Representing a globe on a flat plane requires the use of projections. Cylindrical projections are created by wrapping a piece of paper around the equator to form a cylinder. This was the principle used by the Flemish geographer Geradus Mercator to draw up one of the first reasonably accurate maps of the world in 1569. A Mercator projection shows equatorial regions very accurately and has the advantage that the shape of the landmasses o the map are the same as on the ground, which is useful for navigators. However, away from the equator, the actual areas of the landmasses become more and more distorted so that Greenland seems bigger than Africa. Mercator’s projection is most distorted at the poles because the point of each pole is stretched out into a line as long as the equator.
Arno Peter, a German historian, devised an alternative in 1973. Peter’s projection is also cylindrical but it differs in that the north south scale is adjusted so that the actual areas of the landmasses are accurately represented at all latitudes, although Peters’ projections shows the correct areas of all landmasses, it distorts their shapes. For example Africa appears to have been stretched while Greenland seems squashed.
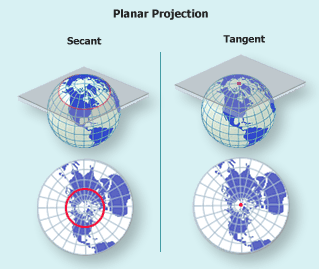
Another form projection is the Zenithal or Azimuthal projection. The paper remains flat and touches the globe at the north or South Pole. Lines of longitude show their correct angles. For this reason they are often used to represent polar region.
A conical projection , in which the paper is rolled into come and placed over the globe to touch it along the line of latitude, shows countries with the minimum of distortion.
Google’s projection is not strictly a projection but a series of manipulations of the curved surface of the sphere. Such maps look rather like the skin of an orange after it has been removed in one piece and rolled out flat. The continents are shown accurately but the oceans are opened up to stretch the segments on to the paper.


good post
ReplyDeleteThanks!!!
ReplyDelete